 View All
Gotcha Gameplay Analytics


Gotcha Gameplay Analytics - Data Visualisation Video
What do you get when you combine 24,000 players travelling almost 2,000 kilometres for two weeks to win a couple of cars?
You get Snepo’s Gotcha mobile game technology which we created a time-lapse video for using the vast amounts of data created from the first Gotcha application, 2DayFM’s Holden Cruze Car Chase.
Each dot here represents a Gotcha player. Green ones are merrily strolling along, until they “take” the virtual car, at which point they turn red to signify their activity. The virtual car moves around as the large red dot, which leaves behind a trace for the day, and flashes yellow when a player takes it.
The visualisation also displays a histogram of player activity during the two-week period, and a cute little clock tracking the time of day. We love how the arterial roads of Sydney can be made out pretty clearly.
We had a lot of fun with this project because it allowed us to use the open source platform, Processing straight to video, without any need to consider loading times and interaction.
See more at Snepo’s Gotcha Case Study
Related projects and articles
-
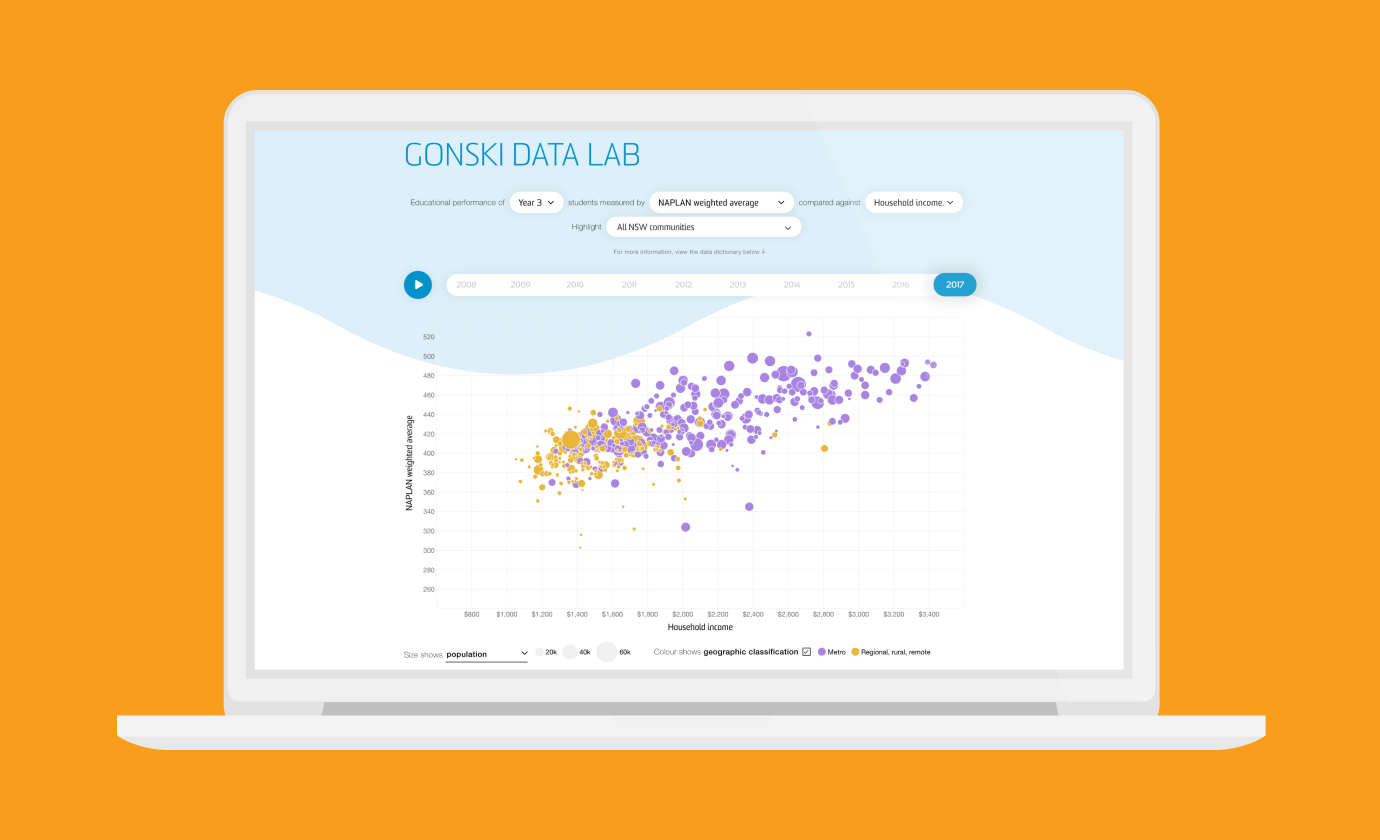
Revealing the social factors behind school performance
Gonski Institute for Education
-

Degree Chooser
Barlow Advisory
-
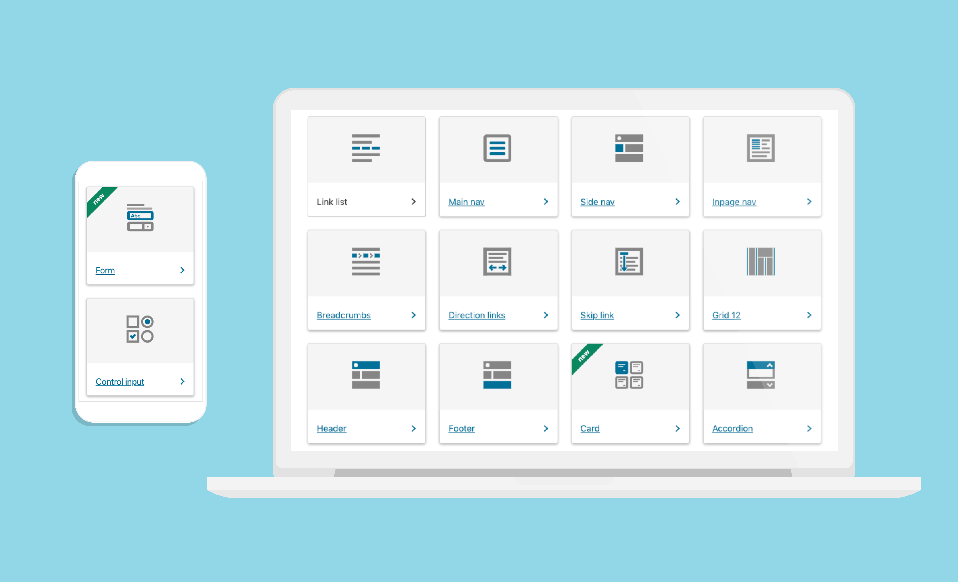
Data Visualisation in Government Design Systems
Article
-
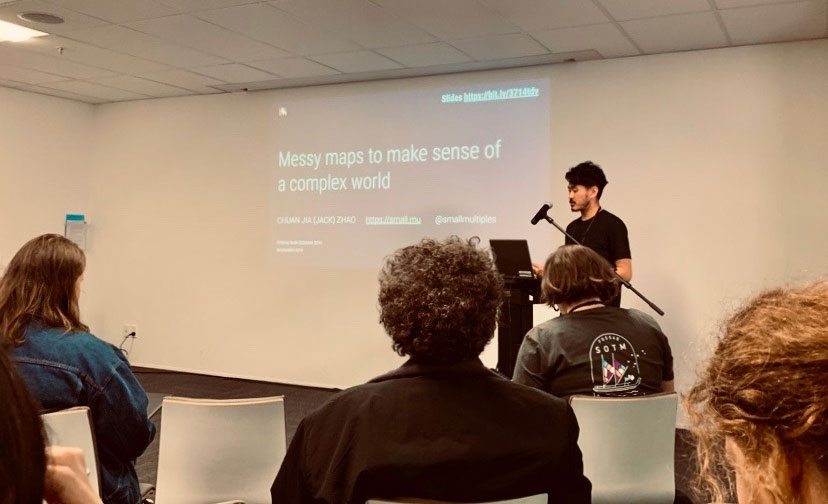
Using dot density maps to visualise complex population data
Article