 View All
Coal Seam Gas Microsite


A data journalism pilot project that explores the topic of coal seam gas in Australia.
Small Multiples had the opportunity of working on the ABC’s first data journalism project on the topic of coal seam gas in Australia with their Radio Multiplatform and News Online divisions, and lead journalist, Wendy Carlisle.
Data journalism is a new frontier in journalism, and indeed in data visualisation, that focuses on letting the data tell the story. Already widely adopted in respected organisations such as the New York Times and The Guardian, the ABC (Australian Broadcasting Corporation) decided to conduct a pilot project.
Small Multiples served as the data visualisation specialists, design and development team, helping to translate the data into visual form.
Data Transparency This project not only highlights the state of coal seam gas in Australia, particularly on the eastern states, but also raises questions about data transparency in governments and industries. Following from data.gov and data.gov.uk, Australia has had some great initiatives (eg) Apps4NSW, that we’ve participated in for data transparency.
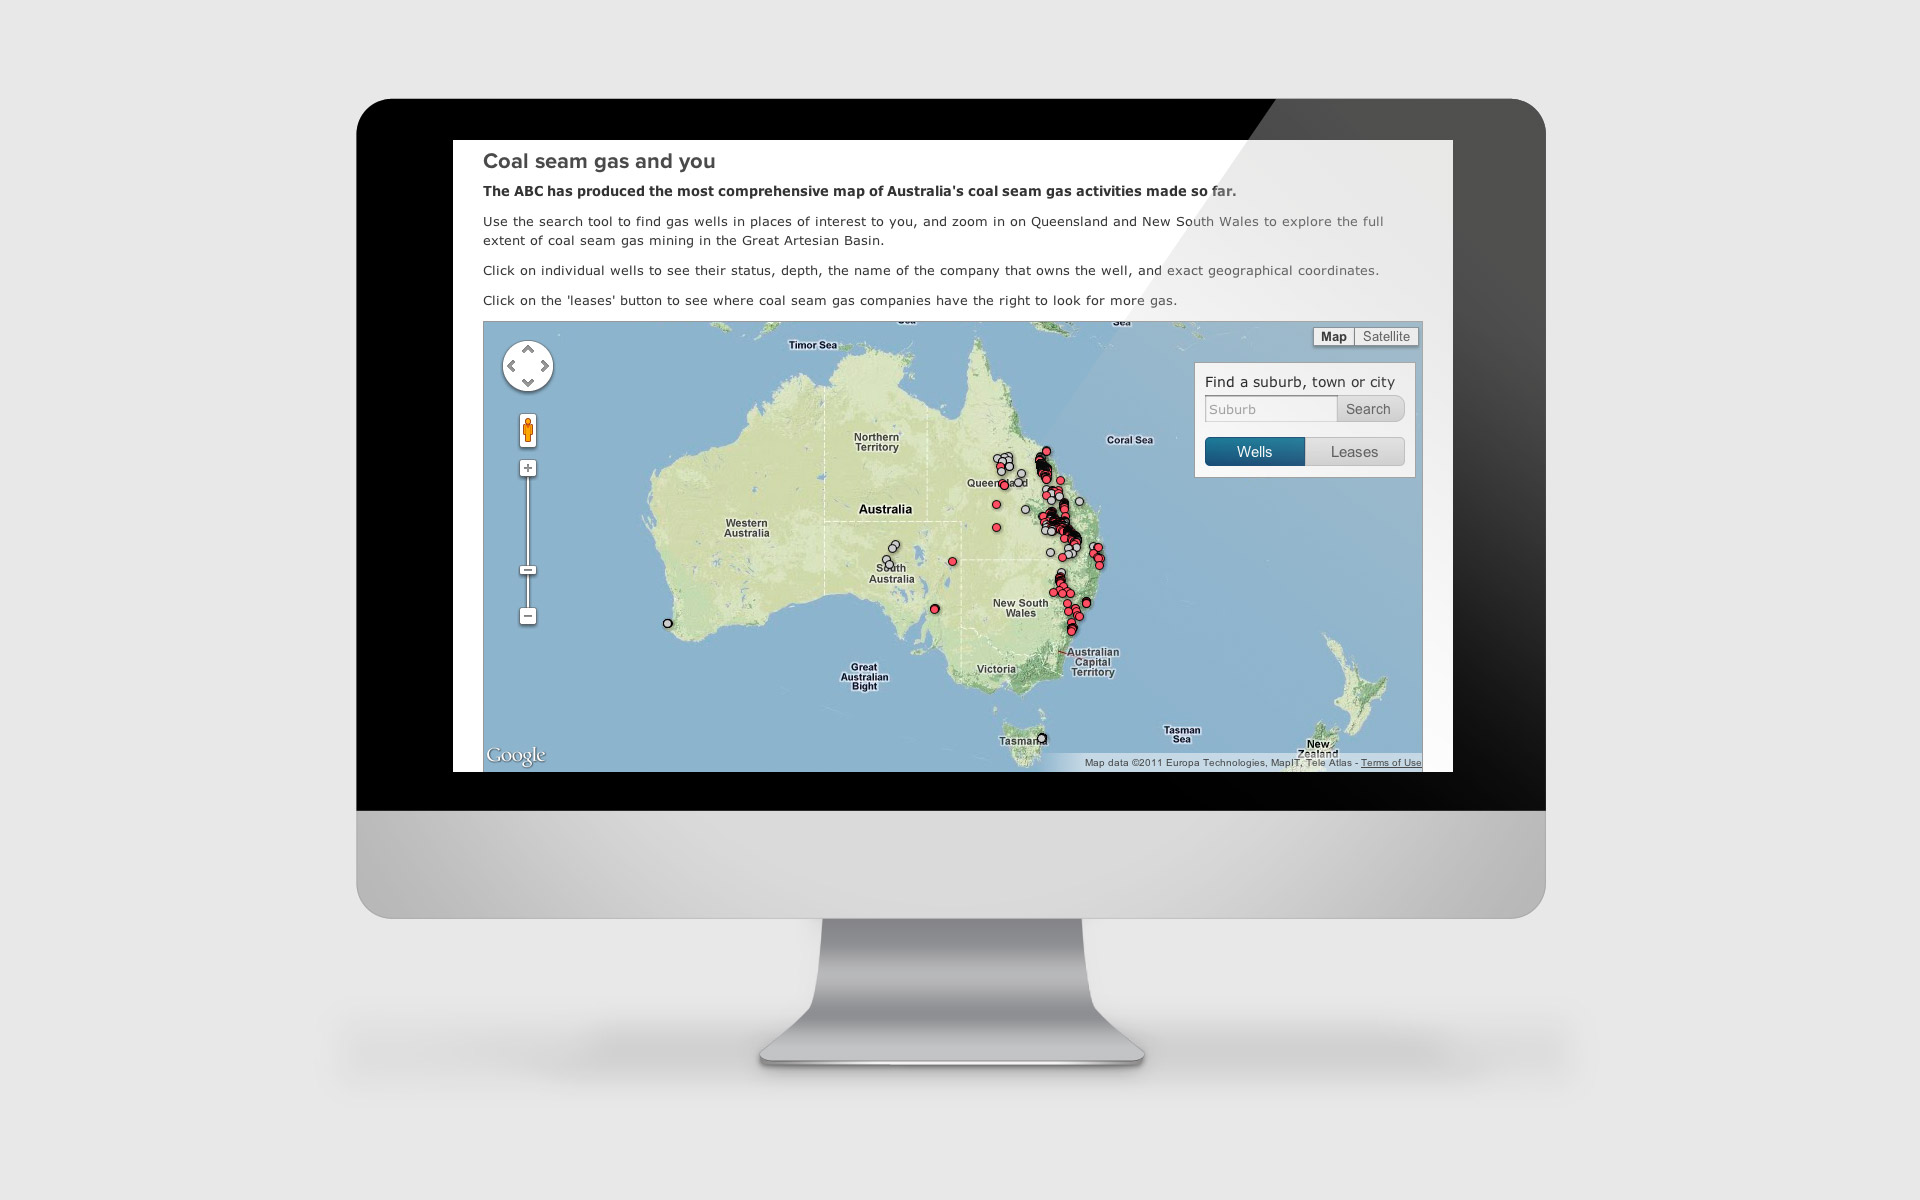
Coal Seam Gas and You Are Australians located near coal seam gas wells? Where are they? This map gathers data from various sources and presents it all in one searchable map, alongside petroleum leases for Queensland and New South Wales. All the data is available in Google Fusion Tables, which means that the map is rendered server-side and dramatically improves the performance of plotting over thousands of points and polygons.
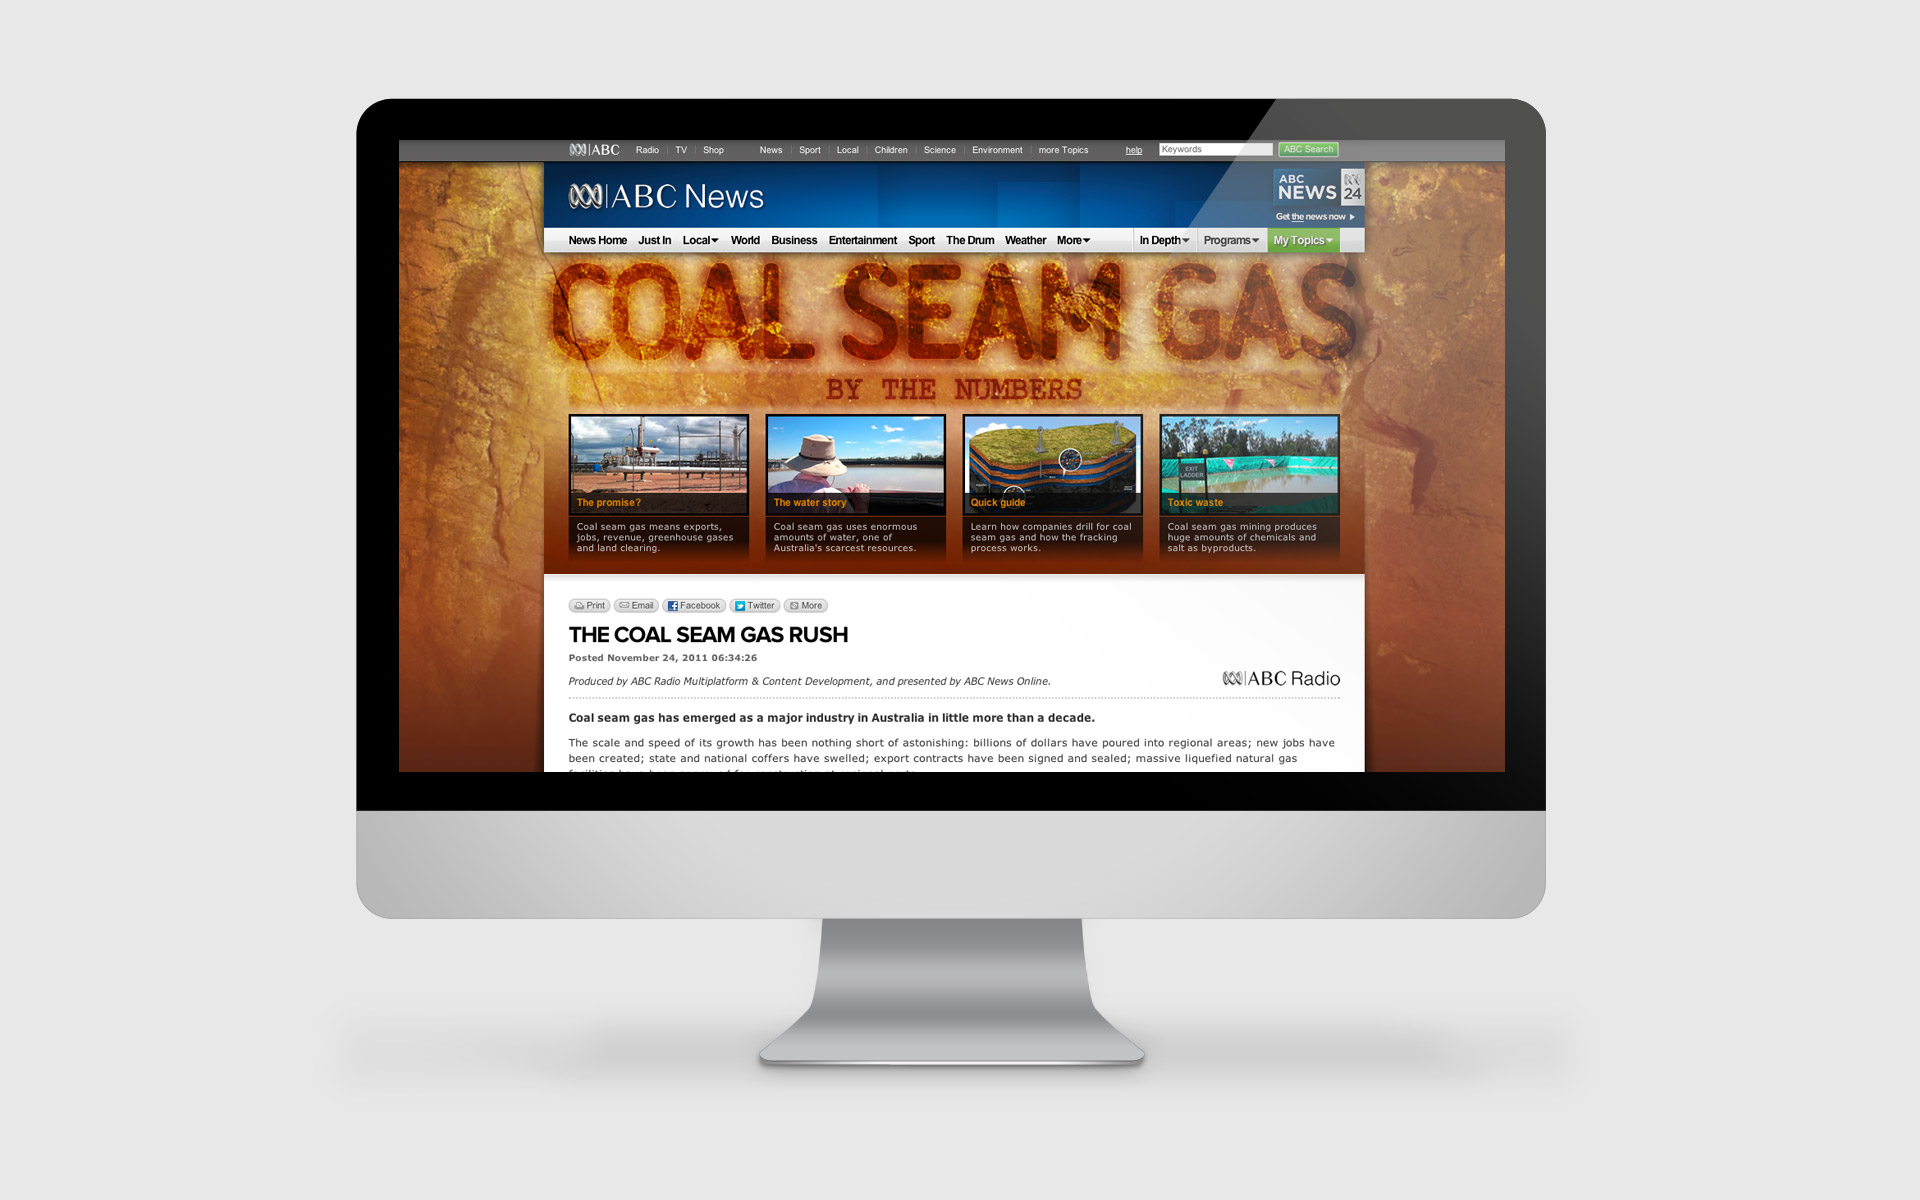
ABC News Online’s Coal Seam Gas Special Small Multiples was only one part of the huge team that brought together the coal seam gas special.
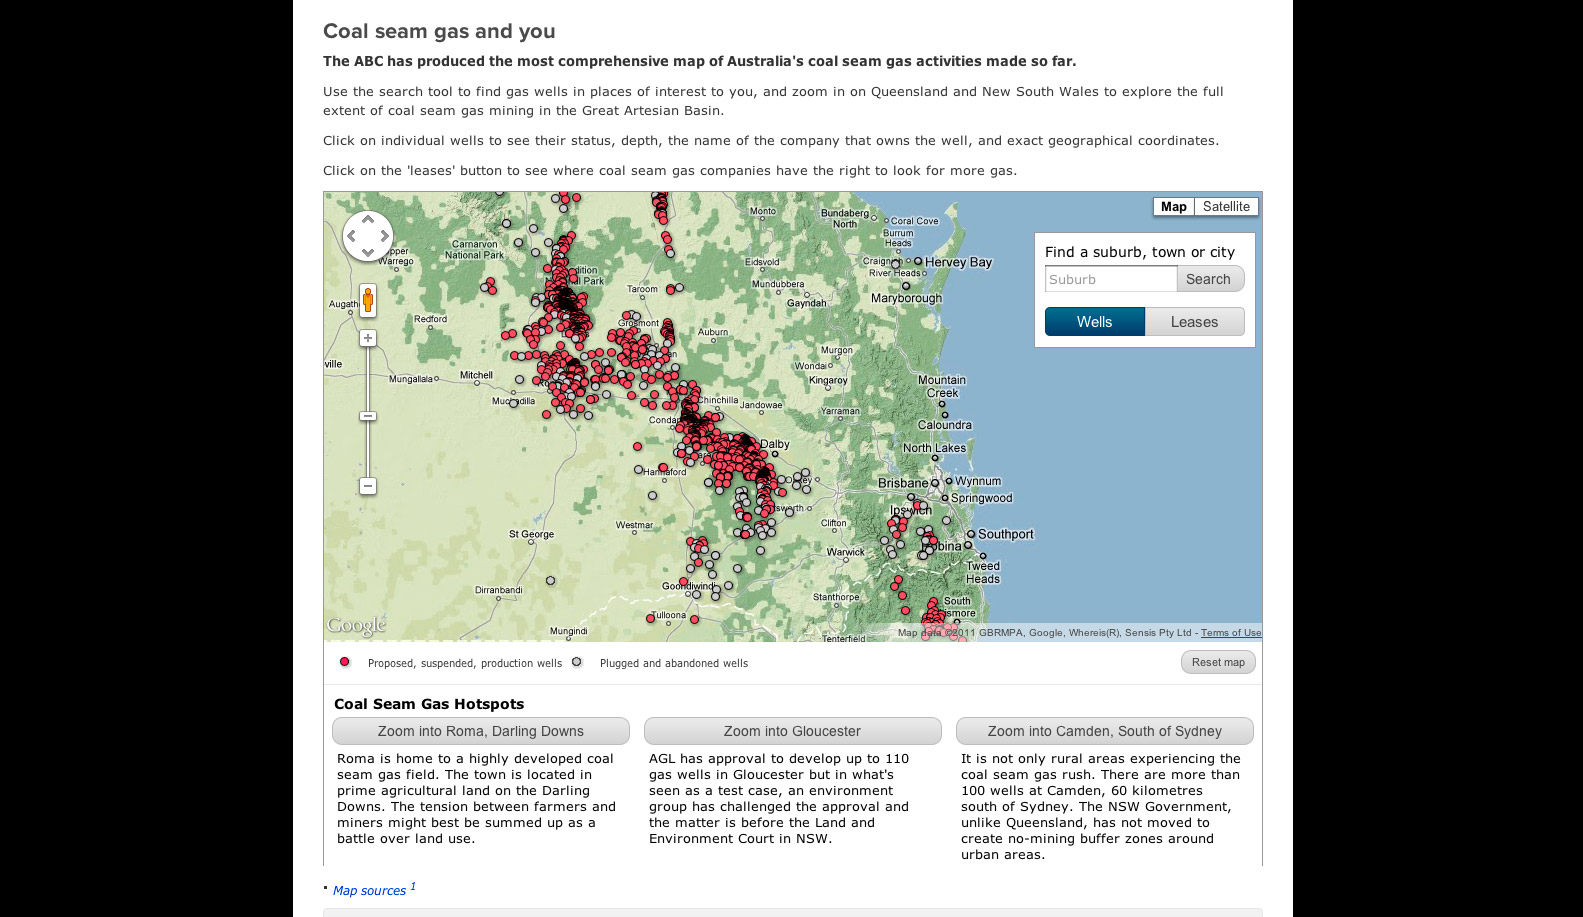
Zoomed in on Queensland The map was effective in demonstrating the shear scale of the coal seam gas industry.
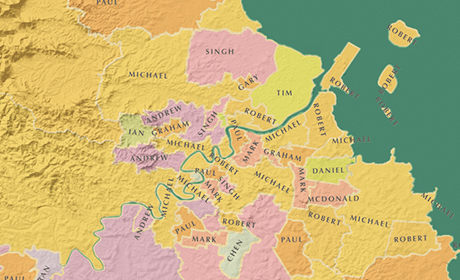
Special Chinchilla Case Study Data found not only helps tell a bigger picture story, but also smaller stories, like this case study of the Chinchilla area. We were able to plot coal seam gas features and land features to highlight their proximity.
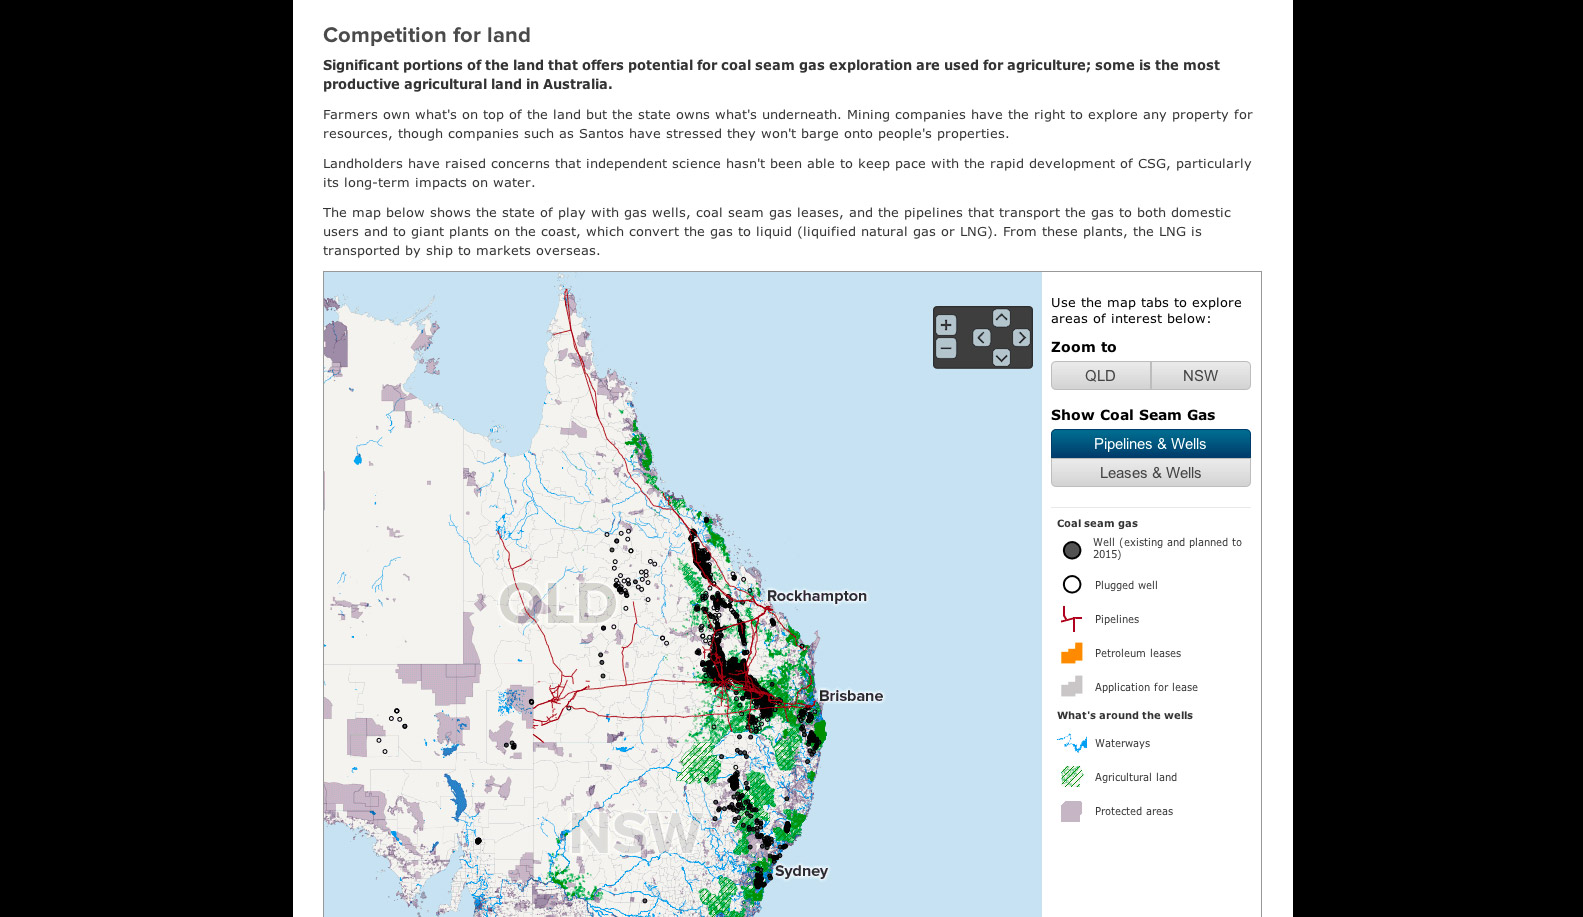
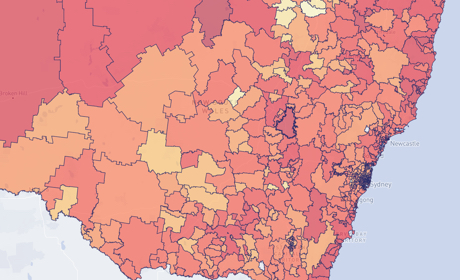
Competition for Land Map The debate about coal seam gas mainly revolves around the issue of land use. One of them is about land and how wells, and general disturbance of land can go on to affect agricultural land, protected areas, and waterways. This map was produced usingTileMill, a very powerful tool for producing custom maps from open standard data formats. Next step, we hope to do some hosted interactive maps.
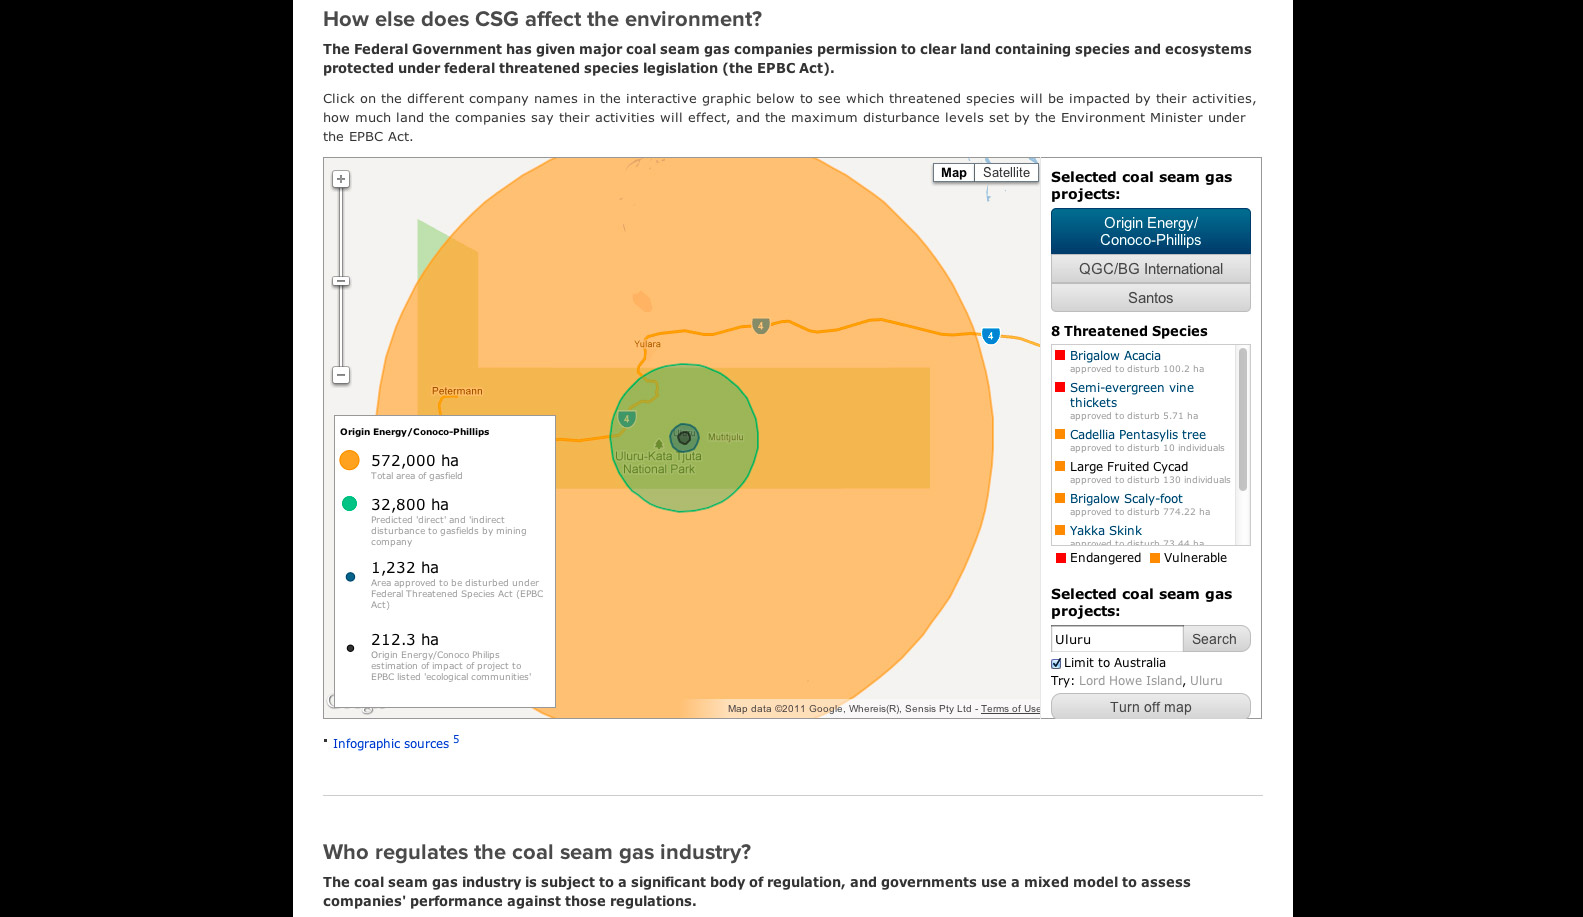
Just How Big? The question has been asked before (BBC’s how big really), but — given the data about coal seam gas leases and environmental impact statements, what do all these hectares mean? This map simply converts hectares into a circular area, and allows users to plot it over a location of their interest e.g. on top of their suburbs.
Related projects and articles
-
Occupational Risk due to COVID-19 in NSW
Article
-
Business empires in Australia
Article
-
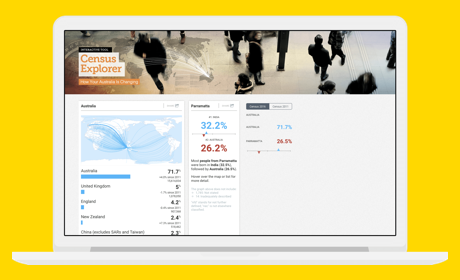
Census Data Explorer
SBS
-
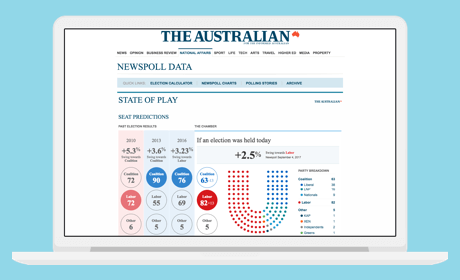
State of Play
The Australian