 View All
Interactive dashboard for the UN Development Programme’s 2020 HDR report


The Challenge
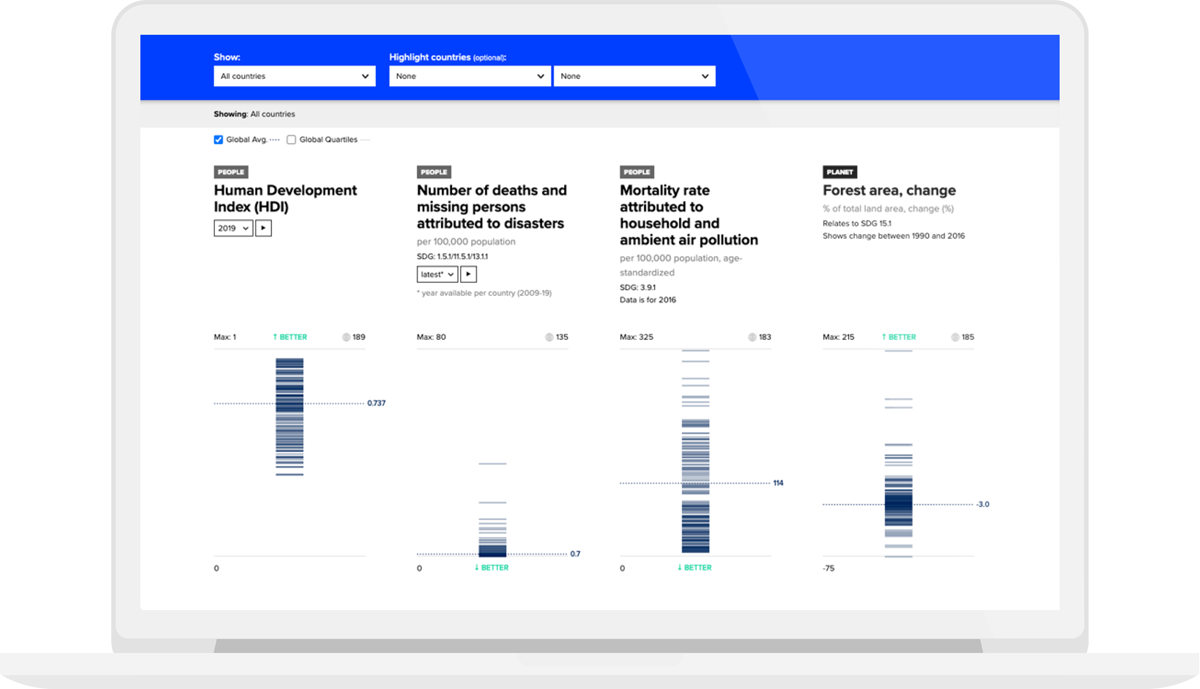
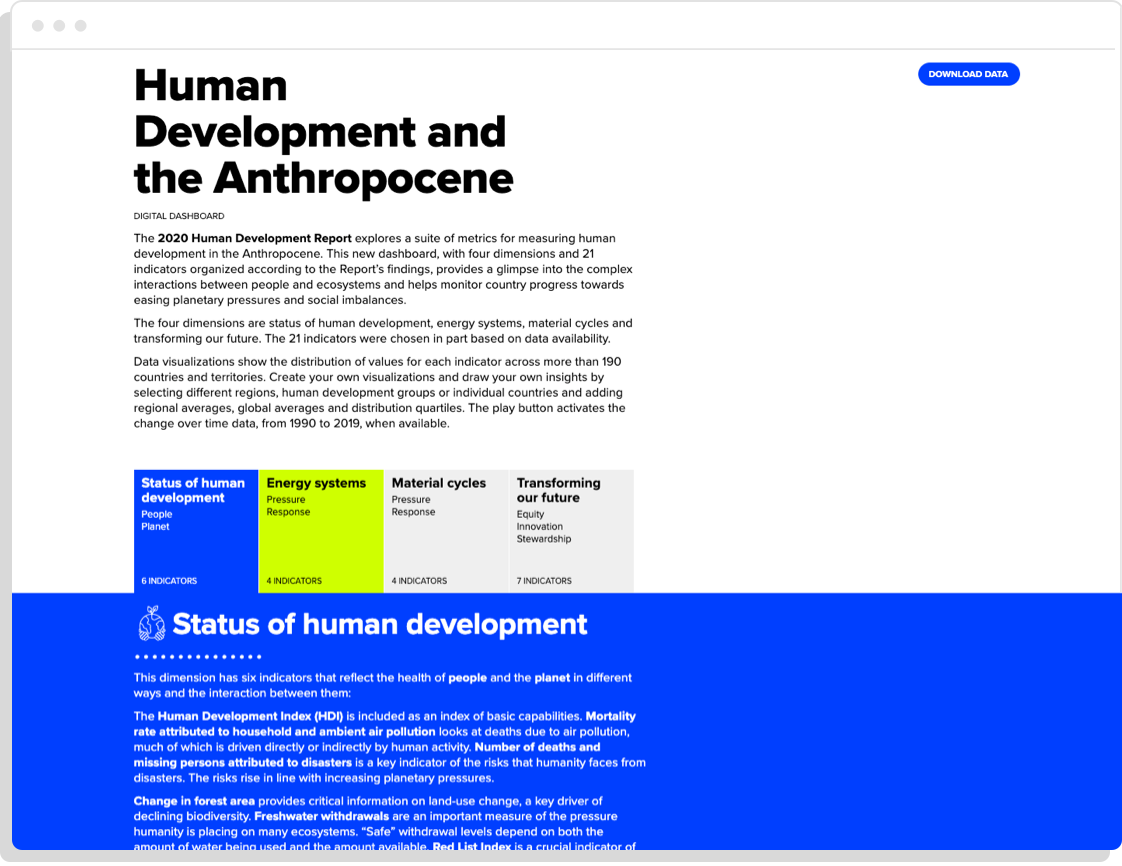
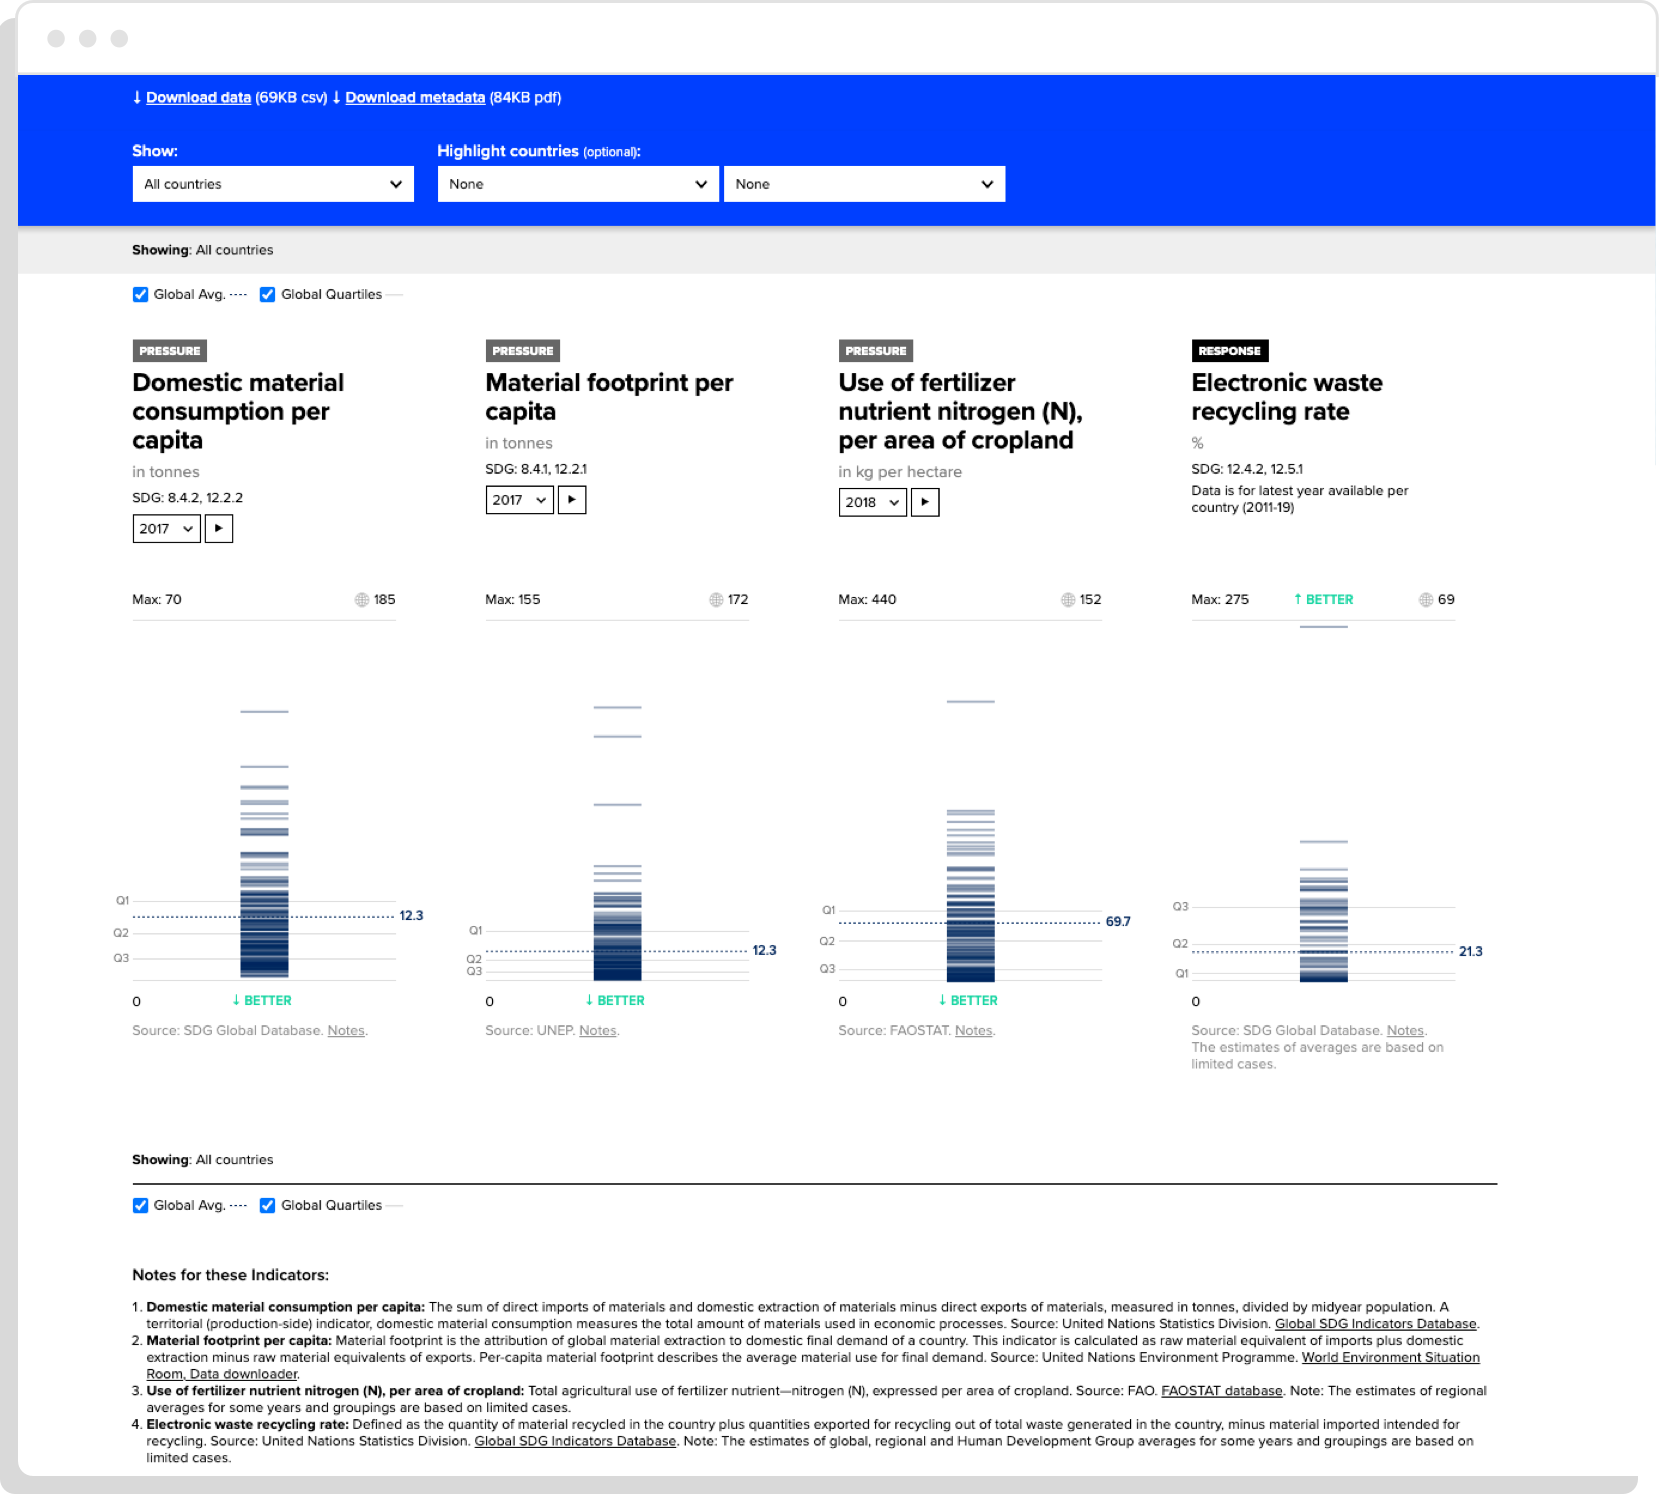
The report covers a wide range of themes: the status of human development (health, mortality and environmental indicators), energy systems (emissions and renewables), material cycles (use and reuse of raw materials) and transforming our future (equity and innovation).
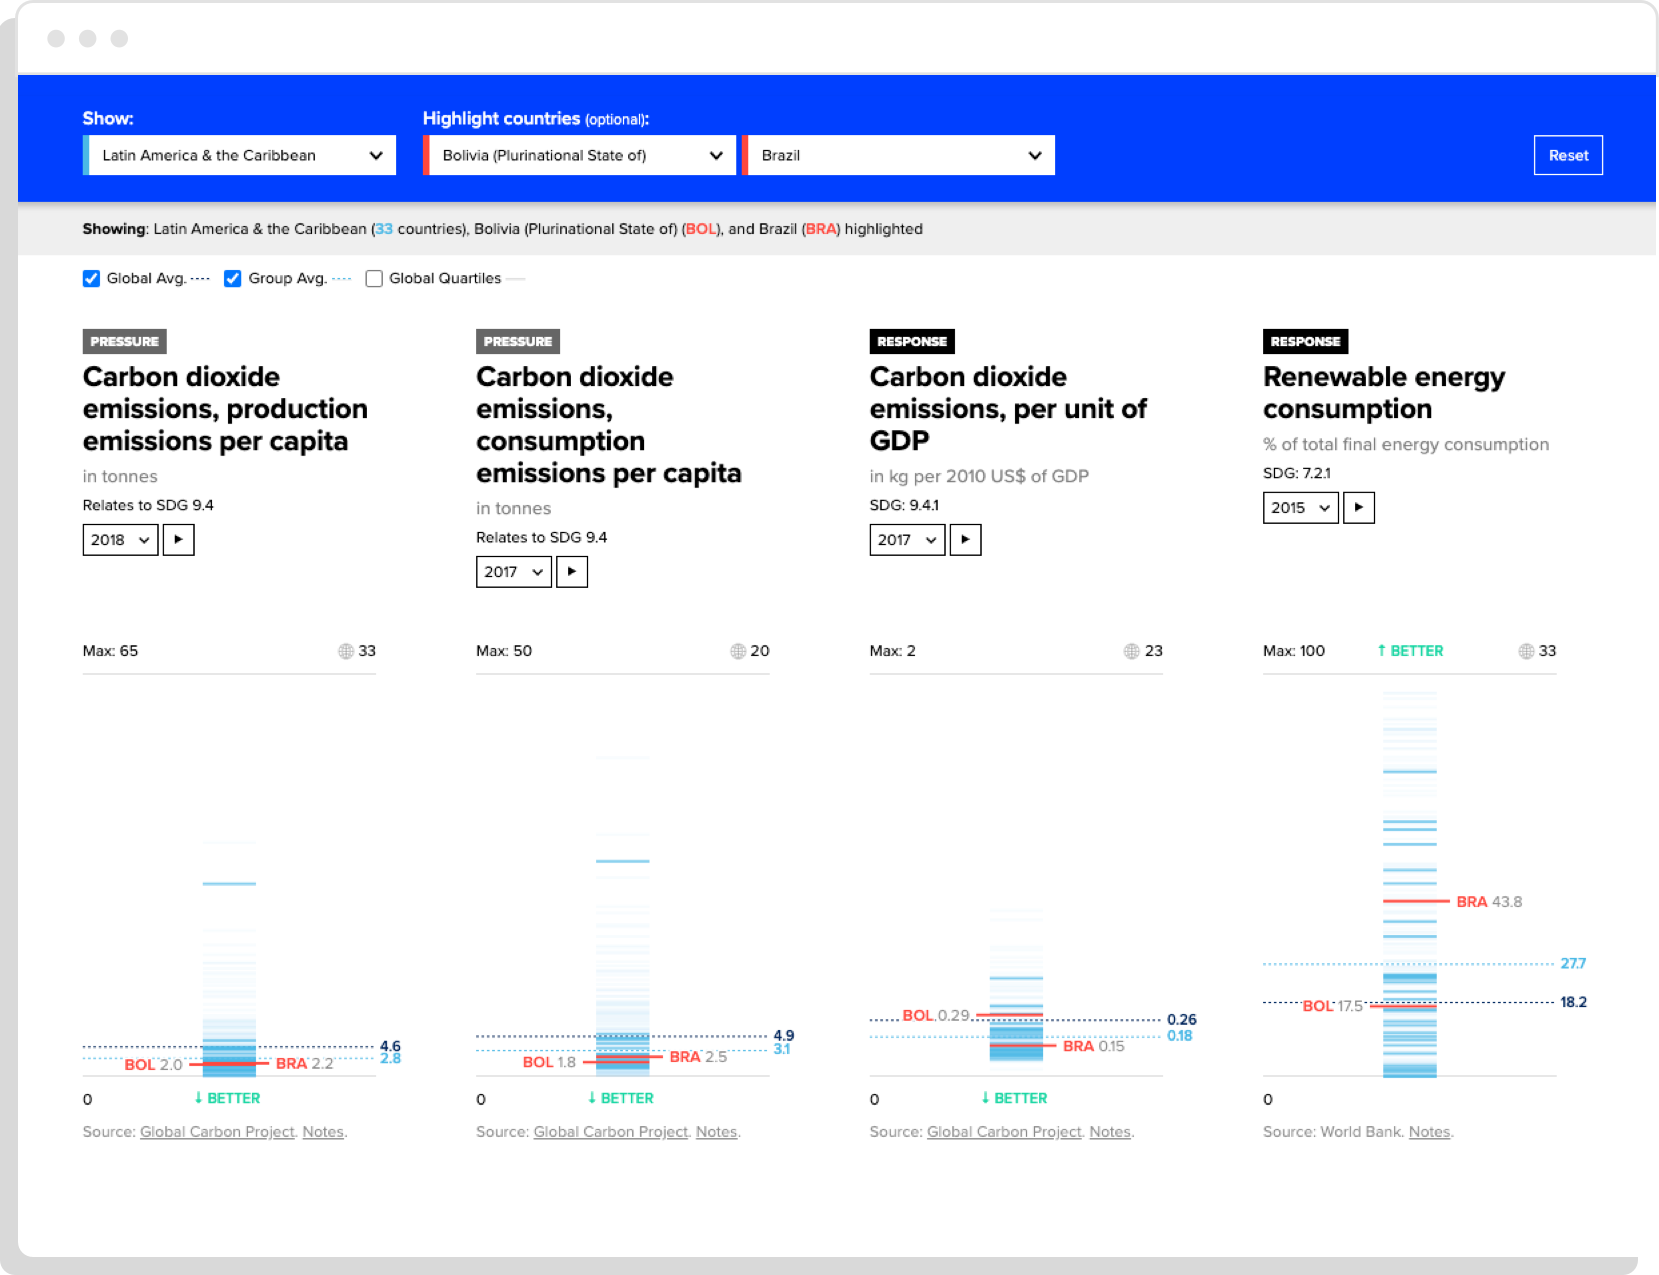
We wanted to give people a broad picture of global development progress, which required showing many different indicators simultaneously. For example, the broader theme of “Energy systems” is broken down into multiple indicators such as carbon emissions per GDP unit and renewable energy consumption, each with data for multiple years and nations.
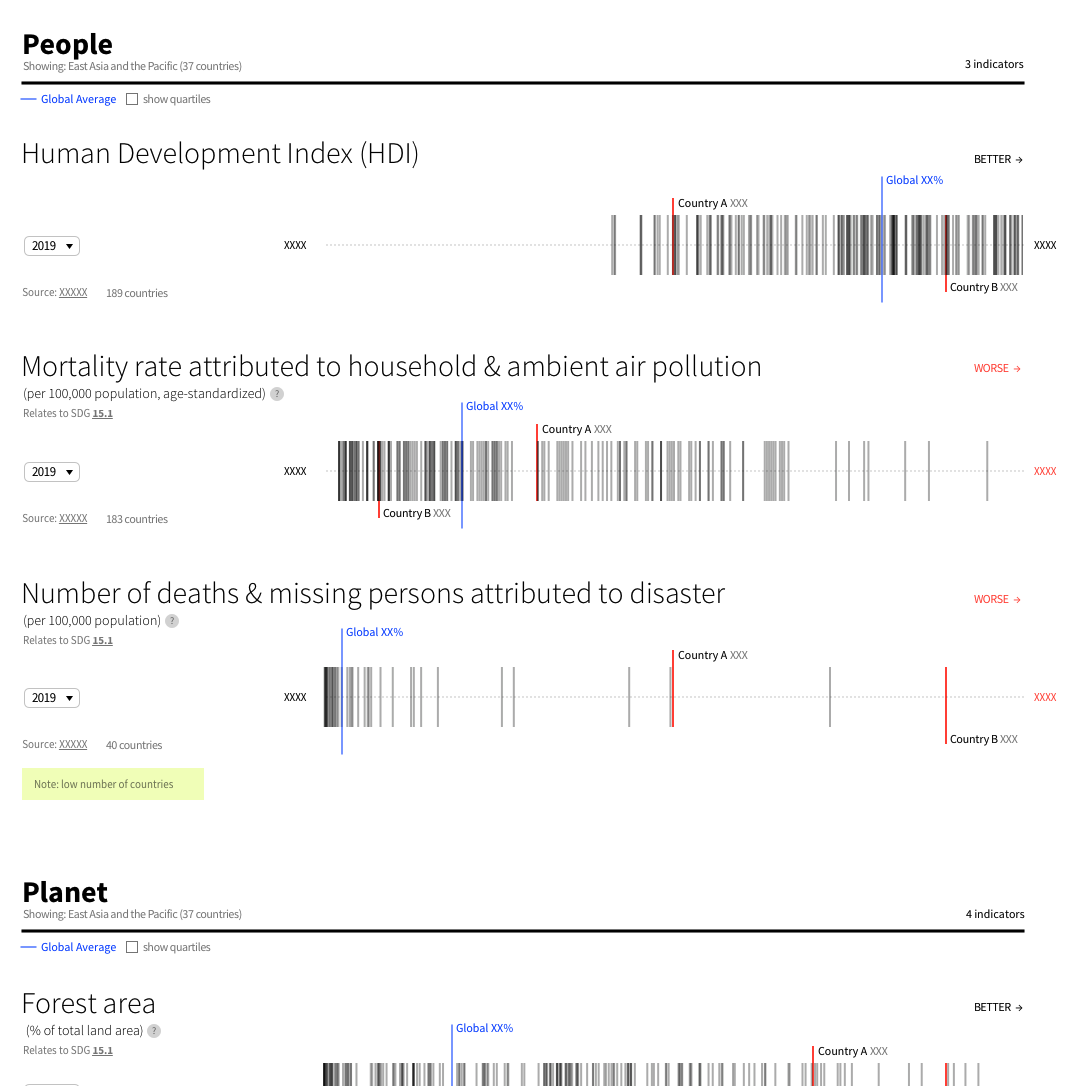
The Human Development Report Office (HDRO) team provided very clean and well-formatted data, but the data itself had challenges to overcome. This was mostly because of data availability: not all countries had data across all indicators or all years, and not all years were available. There were also outliers in the data that we had to account for. Bhutan’s number of deaths and missing persons due to disasters, for example, was unfortunately over five times higher than that of most countries.
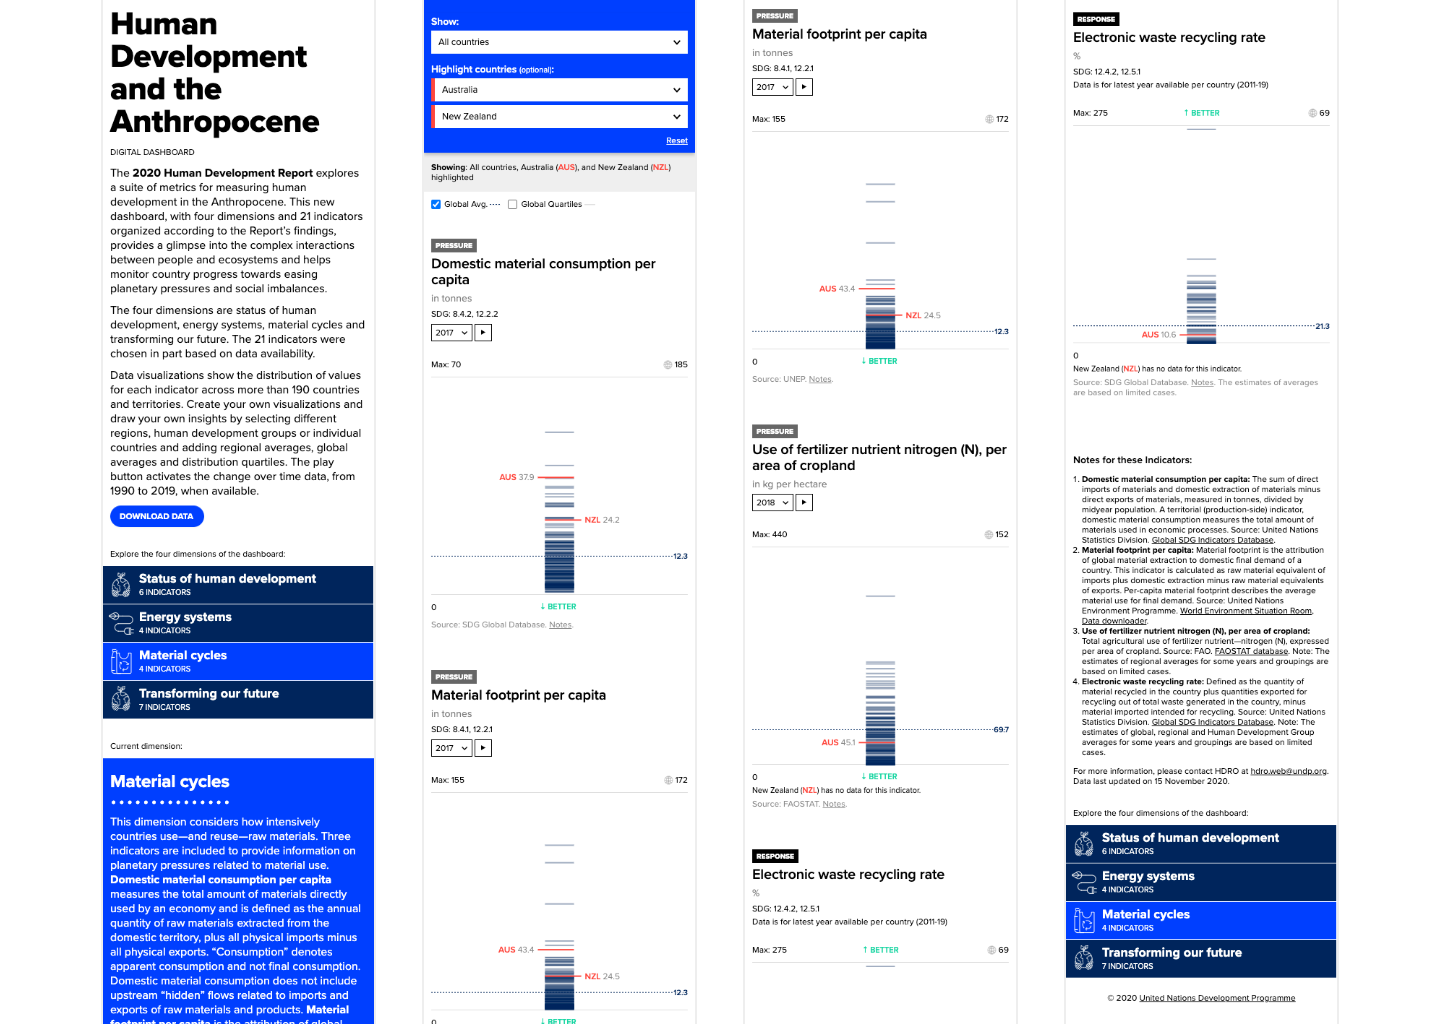
Finally, from a design point of view, we did not want to choose visualisations that singled out countries or biased the interpretation of data. The challenge in making the interactive dashboard responsive (appropriate for mobile viewing) also had to be balanced with how it looks at a desktop size.
The Solution
The result is a responsive, embedded interactive dashboard which groups each theme into tabs and features the same visualisation for all indicators, giving the HDRO ample room for rich explanation.
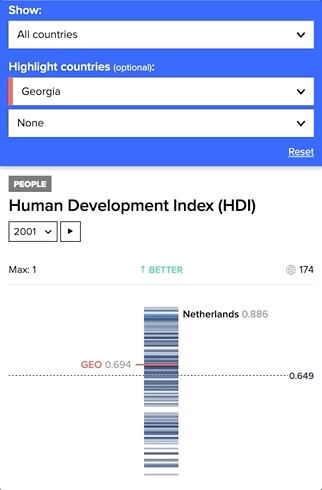
Play mode allows people to see change over time
Data visualisation
With the HDRO’s guidance, we chose to visualise all countries as a distribution to highlight the spread of developmental progress. A hover enables people to identify countries in the context of this spread.
In the case of some outliers (as seen here in the number of deaths and missing persons attributed to disasters), we needed to remove countries from the visualisation to help keep the chart readable, while still noting the existence of the outlier figures.

Filtering
A powerful filtering function and thorough data notes give people the ability to find data relevant to their country, region and topic of interest.
Data tools
We gave more advanced users the ability to download the data and metadata, show quartiles, and provided them with ample data notes.
Responsive
Although we initially explored a horizontal visualisation, we eventually settled on a vertical format to optimise for mobile viewing.
Vertical format optimised for mobile viewing
Original horizontal design
Related projects
- Working with the UNDP on the COVID-19 Socio-Economic Recovery Data Insight Platform.
- Measuring and alleviating Poverty and Inequality in Australia.
- Creating a more accessible and interactive version of a report in the People Matter - Employee Survey.
- Measuring the preventing cancer with the ECL map 12 Ways to reduce your cancer risk.
- Global impact with WHO World Health Systems Report.
Related projects and articles
-
Dynamic Dashboards for Data-Driven Policy Insights and Transparency
Queensland Audit Office
-
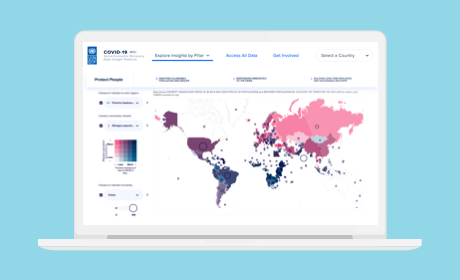
COVID-19 Socio-Economic Recovery Data Insight Platform
United Nations Development Programme
-
Data Visualisation in Government Design Systems
Article
-
Using dot density maps to visualise complex population data
Article